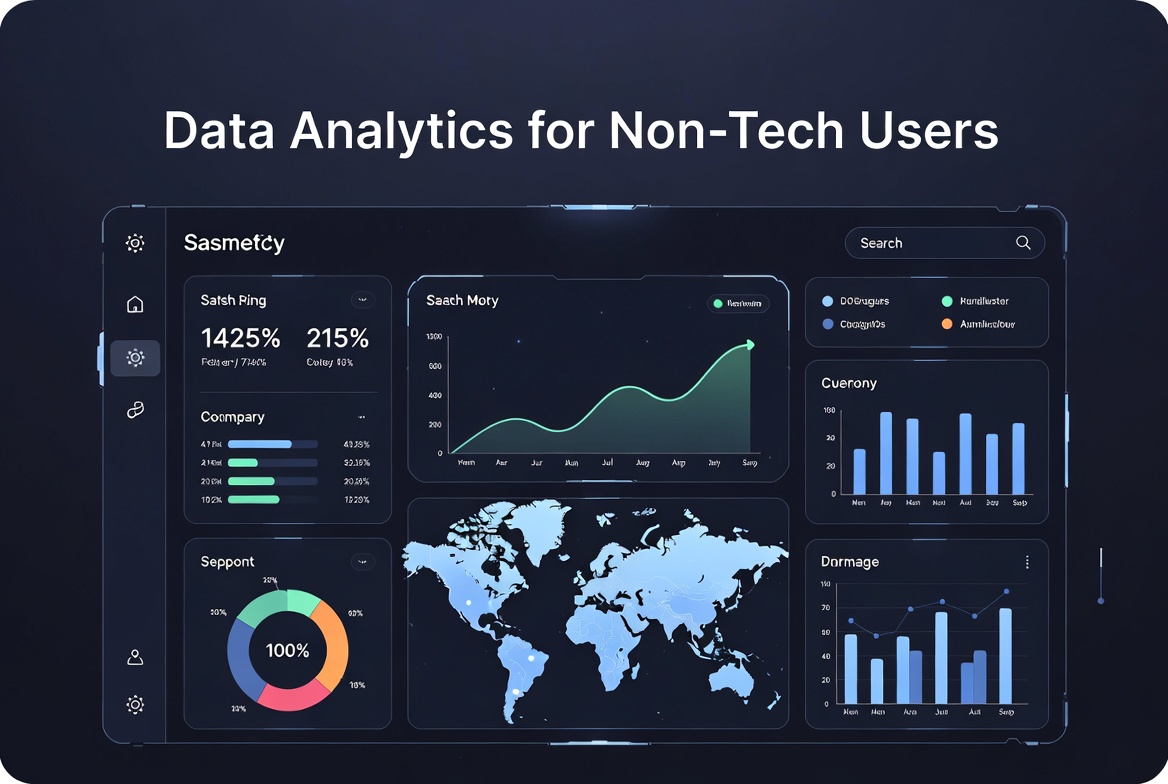
Data Fundamentals for Non-Tech Users
About Course
This beginner-friendly course demystifies data for non-technical learners, empowering them to understand, interpret, and communicate data confidently. This masterclass focuses on practical data literacy, real-world applications, and decision-making skills. Learners will explore how data flows through organizations, how to ask the right questions, and how to use data to solve problems without writing code.
What Will You Learn?
- What data is and why it matters in everyday life and work
- Types of data: structured, unstructured, qualitative, quantitative
- How data is collected, stored, and managed
- How to read and interpret charts, tables, and dashboards
- The four types of analytics: descriptive, diagnostic, predictive, prescriptive
- How to ask good questions and make data-driven decisions
- Data ethics, privacy, and responsible use
- How to communicate insights using visuals and storytelling
Course Content
Module 1 — What is data and why does it matter?
Understand the role of data in everyday decisions.
-
Definitions and examples of data
-
Structured vs. unstructured data
-
Data in business, health, education, and society
-
Data lifecycle: collection → storage → analysis → action
Module 2 — Reading and interpreting data
Learn to make sense of tables, charts, and dashboards.
-
Common chart types: bar, line, pie, scatter
-
Tables and cross-tabulations
-
Dashboards: what they show and how to read them
-
Spotting trends, patterns, and outliers
Module 3 — Asking good questions with data
Frame problems and explore data meaningfully.
-
Types of questions: what, why, how, what if
-
Data sources and reliability
-
Bias and assumptions in data
-
Building a data inquiry framework
Module 4 — Types of analytics and decision-making
Use data to understand, explain, and predict.
-
Descriptive analytics: what happened?
-
Diagnostic analytics: why did it happen?
-
Predictive analytics: what might happen?
-
Prescriptive analytics: what should we do?
Module 5 — Communicating insights with visuals
Share findings clearly and persuasively.
-
Choosing the right chart for the message
-
Visual design principles: clarity, contrast, context
-
Storytelling with data: structure and flow
-
Presenting to different audiences (managers, clients, public)
Module 6 — Data ethics and responsible use
Understand the risks and responsibilities of working with data.
-
Privacy and consent
-
Misuse and manipulation of data
-
Inclusive and fair data practices
-
Real-world examples of ethical dilemmas
Module 7 — Capstone: Data in action
Apply what you’ve learned to a real-world scenario.
-
Choose a topic (e.g., school performance, local business, health trends)
-
Frame a question and explore available data
-
Create a visual summary and decision memo
-
Present findings in a short report or slide deck
Earn a certificate
Add this certificate to your resume to demonstrate your skills & increase your chances of getting noticed.
